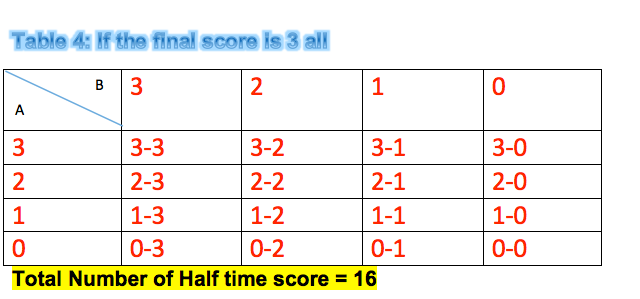
When the scores are drawn/tied, it means that the scores on both teams are equal (no team wins). There are two methods that I used to find the possible half time scores.
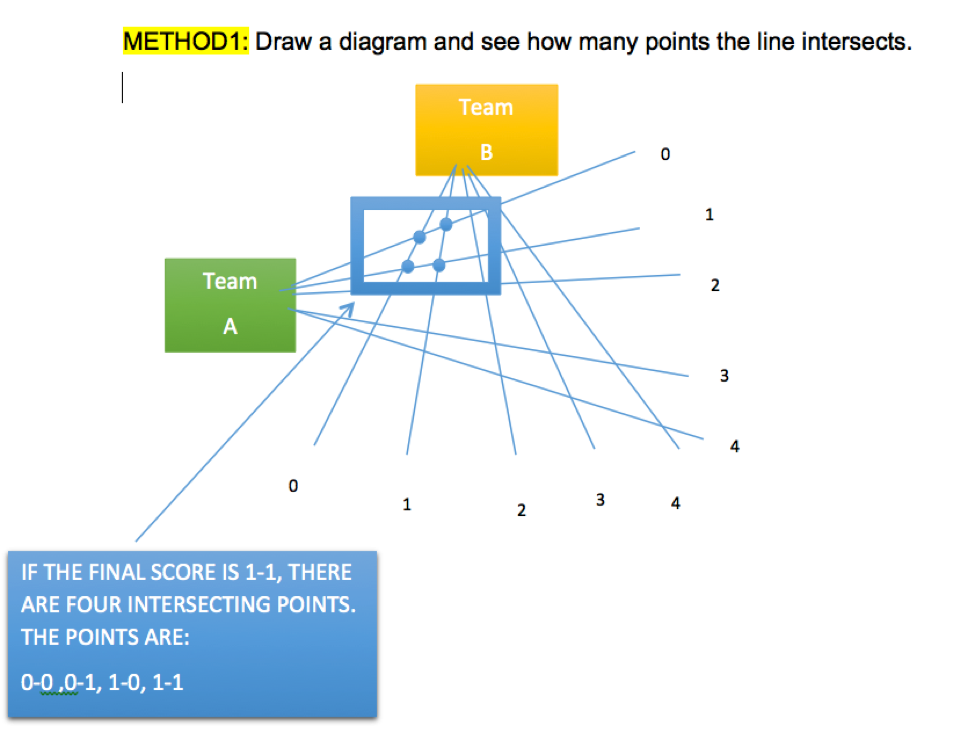
Diagram 1
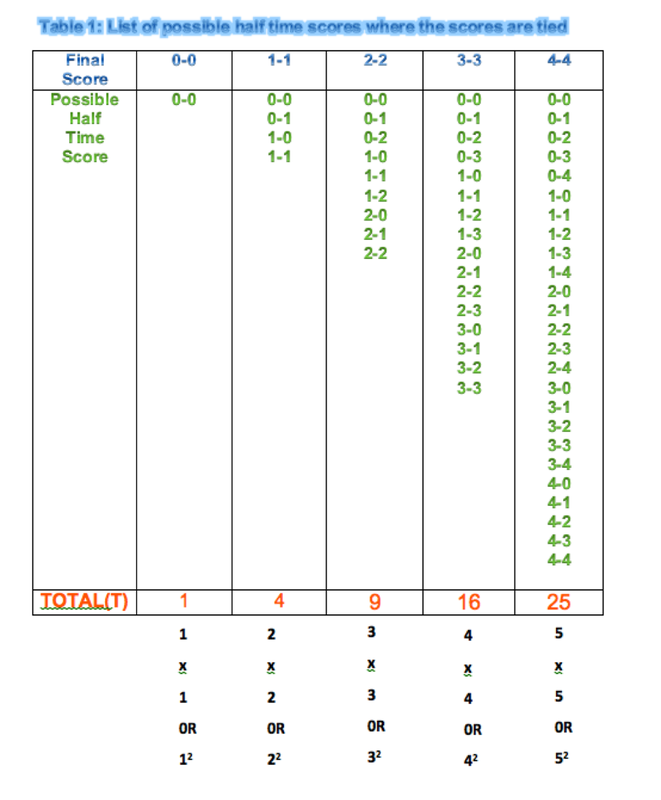
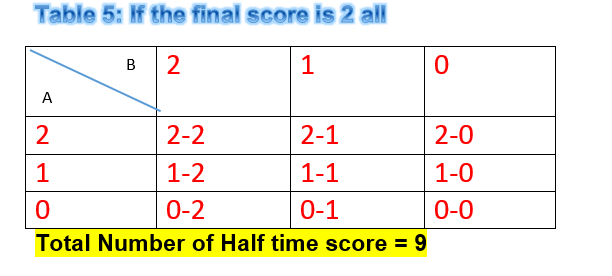
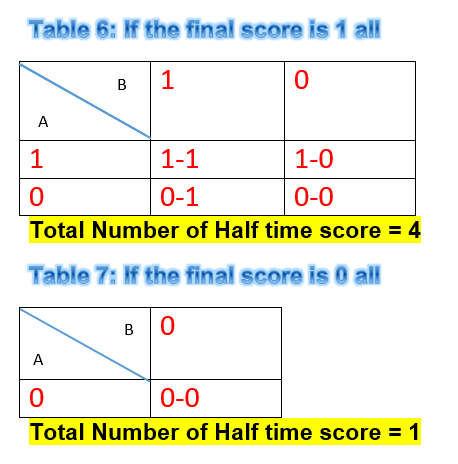
Then, I listed the final results out in another table to make the data clearer and easier to understand.
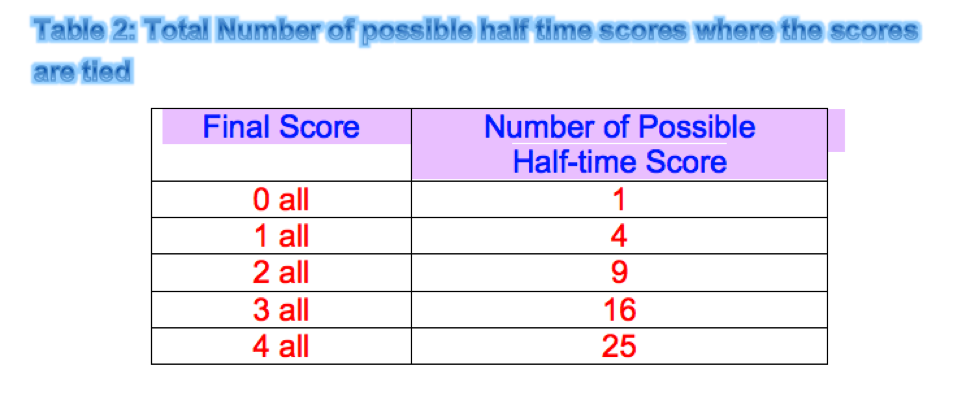
From this table, I noticed that the total number of possible half time scores is a square number

Diagram 2
From this diagram 2, I noticed that the first difference goes up in a pattern of 3, 5, 7, 9, and so on. However the second difference is a constant of 2. This means that this is a quadratic number pattern with a general formula:

To find the value of a, the rule is the half of the second difference.
a = ½ (second difference)
= ½ (2)
= 1
To find the value of c, the rule is the value of y when x = 0. Looking at diagram 2, y = 1 when x = 0 (0-0)
c = 1
The equation right now is:
a = ½ (second difference)
= ½ (2)
= 1
To find the value of c, the rule is the value of y when x = 0. Looking at diagram 2, y = 1 when x = 0 (0-0)
c = 1
The equation right now is:

To find the value of b, the rule is to take any value of x and the corresponding y. Go back to the diagram and let’s choose when x = 1 (1-1), y = 4
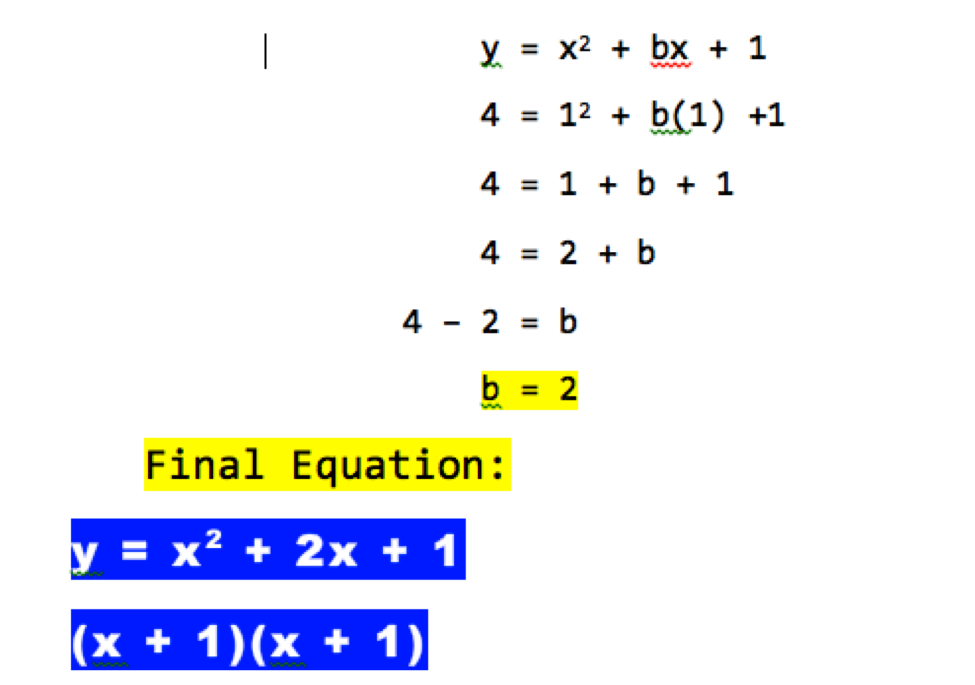
Therefore, I came up with an equation.
T = (A + 1)(B + 1)
T = (X +1) 2
Where T = Total number of possible Half time score
A = final score of team A
B = final score of team B
A = B = X = if the game is a draw
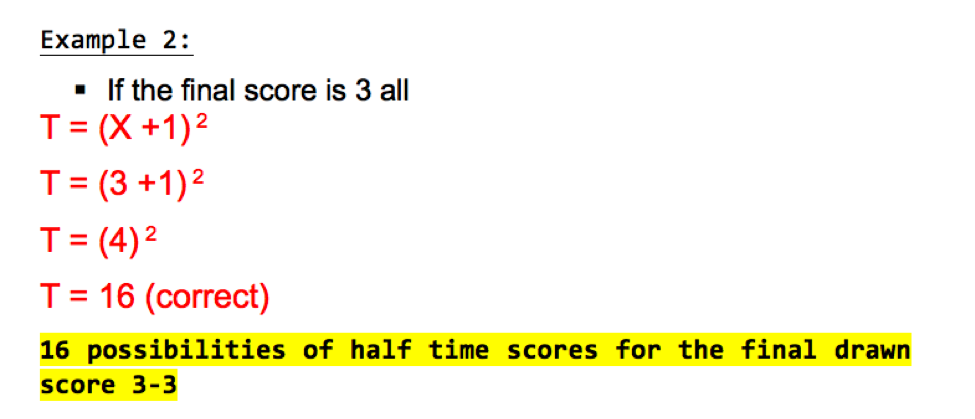
Finally, to ensure that the formula is correct, I tried two examples and compared it to table 2.
T = (A + 1)(B + 1)
T = (X +1) 2
Where T = Total number of possible Half time score
A = final score of team A
B = final score of team B
A = B = X = if the game is a draw
Finally, to ensure that the formula is correct, I tried two examples and compared it to table 2.
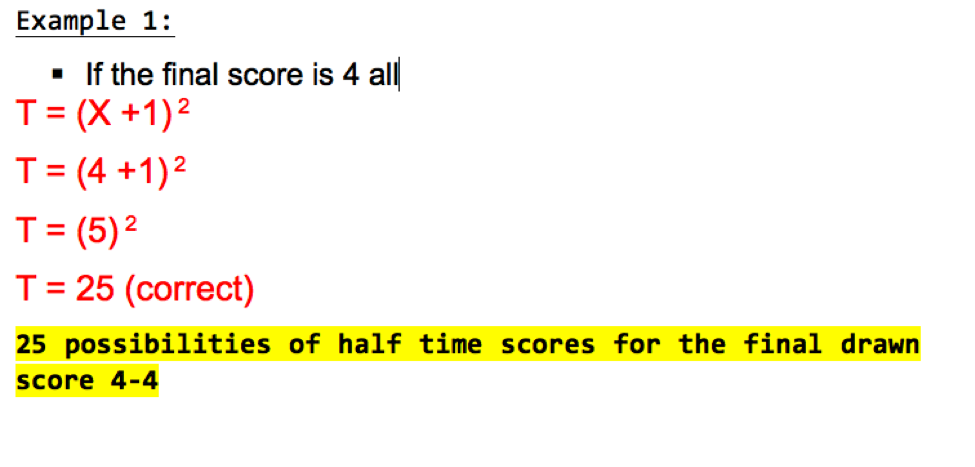
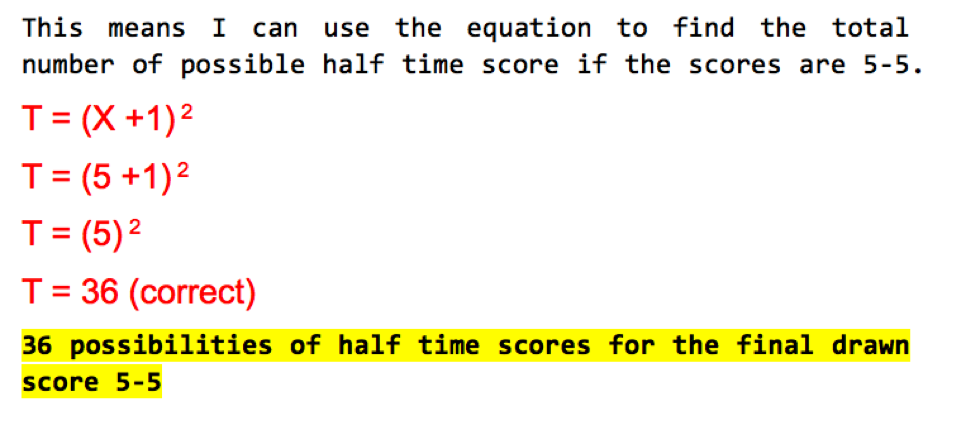
Conclusion: If a game ends in a draw, you can find the number of possible half-time scores by using the equation:

Method 2: Make a table to find the number of possible half time scores.
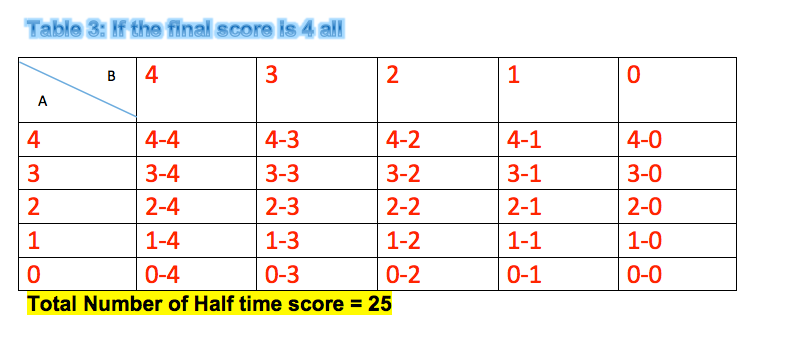
NOTE: Using method 2 is another way to generate the results in table 2. Both methods will yield the same results
